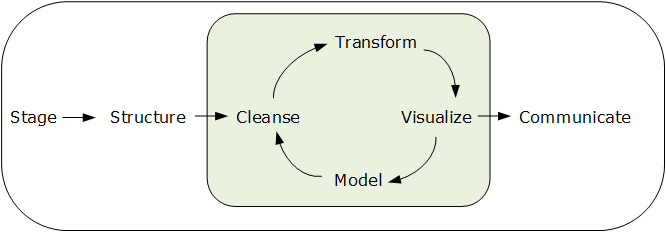
This week, we focused specifically on reviewing some of the key procedures SAS offers for business statistics and data grouping such as Proc means, Proc freq, Prod univariate, Proc standardize, and Proc Fastclust, and of course, we continued our review of macros and passing variables through these functions to allow for faster variable analysis and processing.
There were 2 aspects of this week’s lesson I found most interesting…and challenging as well: 1. -Standardizing data (moving all the quantitative data to the same scale i.e. mean=0 and stand dev = 1. This concept was somewhat of a continuation of our project from week 2 where we analyzed stock price valuations based on a standardized scale. This step was necessary to produce clusters of data on the same scale. Then, after performing descriptive statistics on the standardized variables, we needed to unstandardized the data to make the numbers make sense from a business standpoint. 2 – creating clusters. Creating clusters using K-means was a brand new concept to me, but the methodology was fascinating – The computer picks random data points for the observations and begins to categorize the data in each bucket (K). The program then takes the average of each cluster and re-runs the program until all data is correctly categorized into their respective clusters.
Visualizing the k means clustering using the tasks mentioned above combined with proc SG plot, provided a clear depiction of the groups created by the program, and allows the analyst to see the natural groupings of the observations within the variables under consideration. I can see the value of performing K Means clustering in a variety of scenarios / industries. For example, K Means clustering could be used to credit fraud and cyber security attacks, but grouping data with similar characteristics and detecting outliers. This week’s lesson carried a lot of value and I’m sure we’ll continue to re-visit this concept of categorization and clustering throughout the class.